How to Do Infographic Link Building: A Beginner’s Guide
In a highly competitive SEO market, infographic link building is necessary to build high-quality backlinks from authoritative sources.
Why?
Because link building strategies like guest posting and link exchange are simply not enough. You need to offer more value to authoritative sites to get a link from them and infographics offer enormous informational and engagement value.
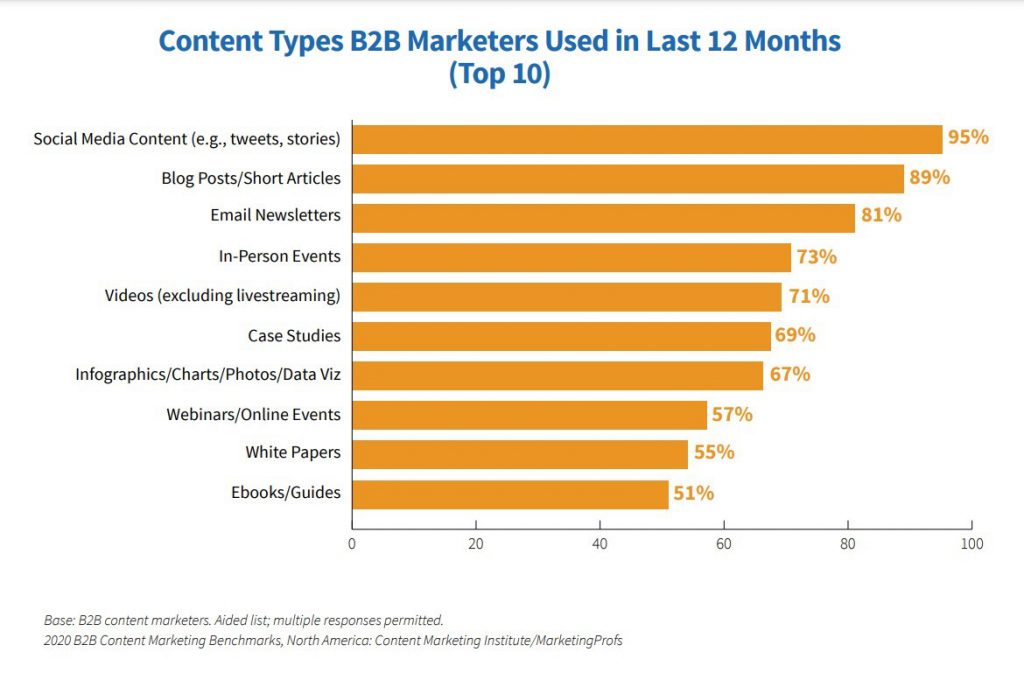
It’s not surprising that infographics are quite popular and widely used by marketers. According to a 2020 study by CMI, 67% of the B2B marketers used infographics.
Alright, the use of infographics for a link-building campaign seems promising enough to move forward. But the real catch is how to perform infographic link building the right way.
Well, this is what this guide is about. We’ll discuss the types of infographics you can use and how to create and market them for link-building purposes.
So, let’s get started.
Types of Infographics
You need to know the different types of infographics you can create to get started with infographic link building.
Here are the eight most common types of infographics you can pick from.
1. Statistical Infographics
This is the best type of infographic to present survey results, backup an opinion with relevant data, or visualize data from multiple sources.
This type of infographic showcases your data, and the layout or structure will help you tell the story behind it. You may use charts, icons, images, or captivating fonts to tell your story via such infographics. With an ai image generator, creating these visual elements becomes faster and more creative, allowing you to focus on presenting your data effectively.
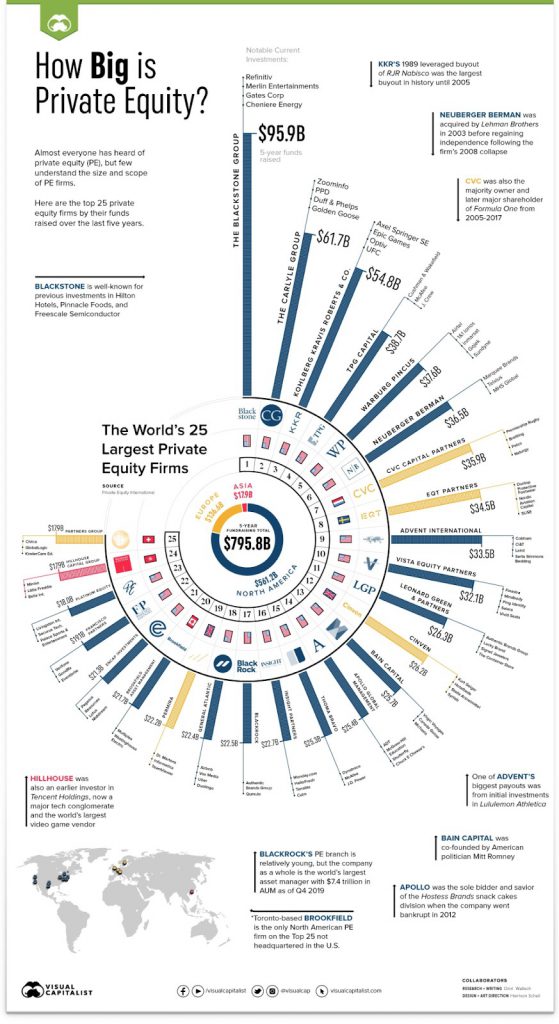
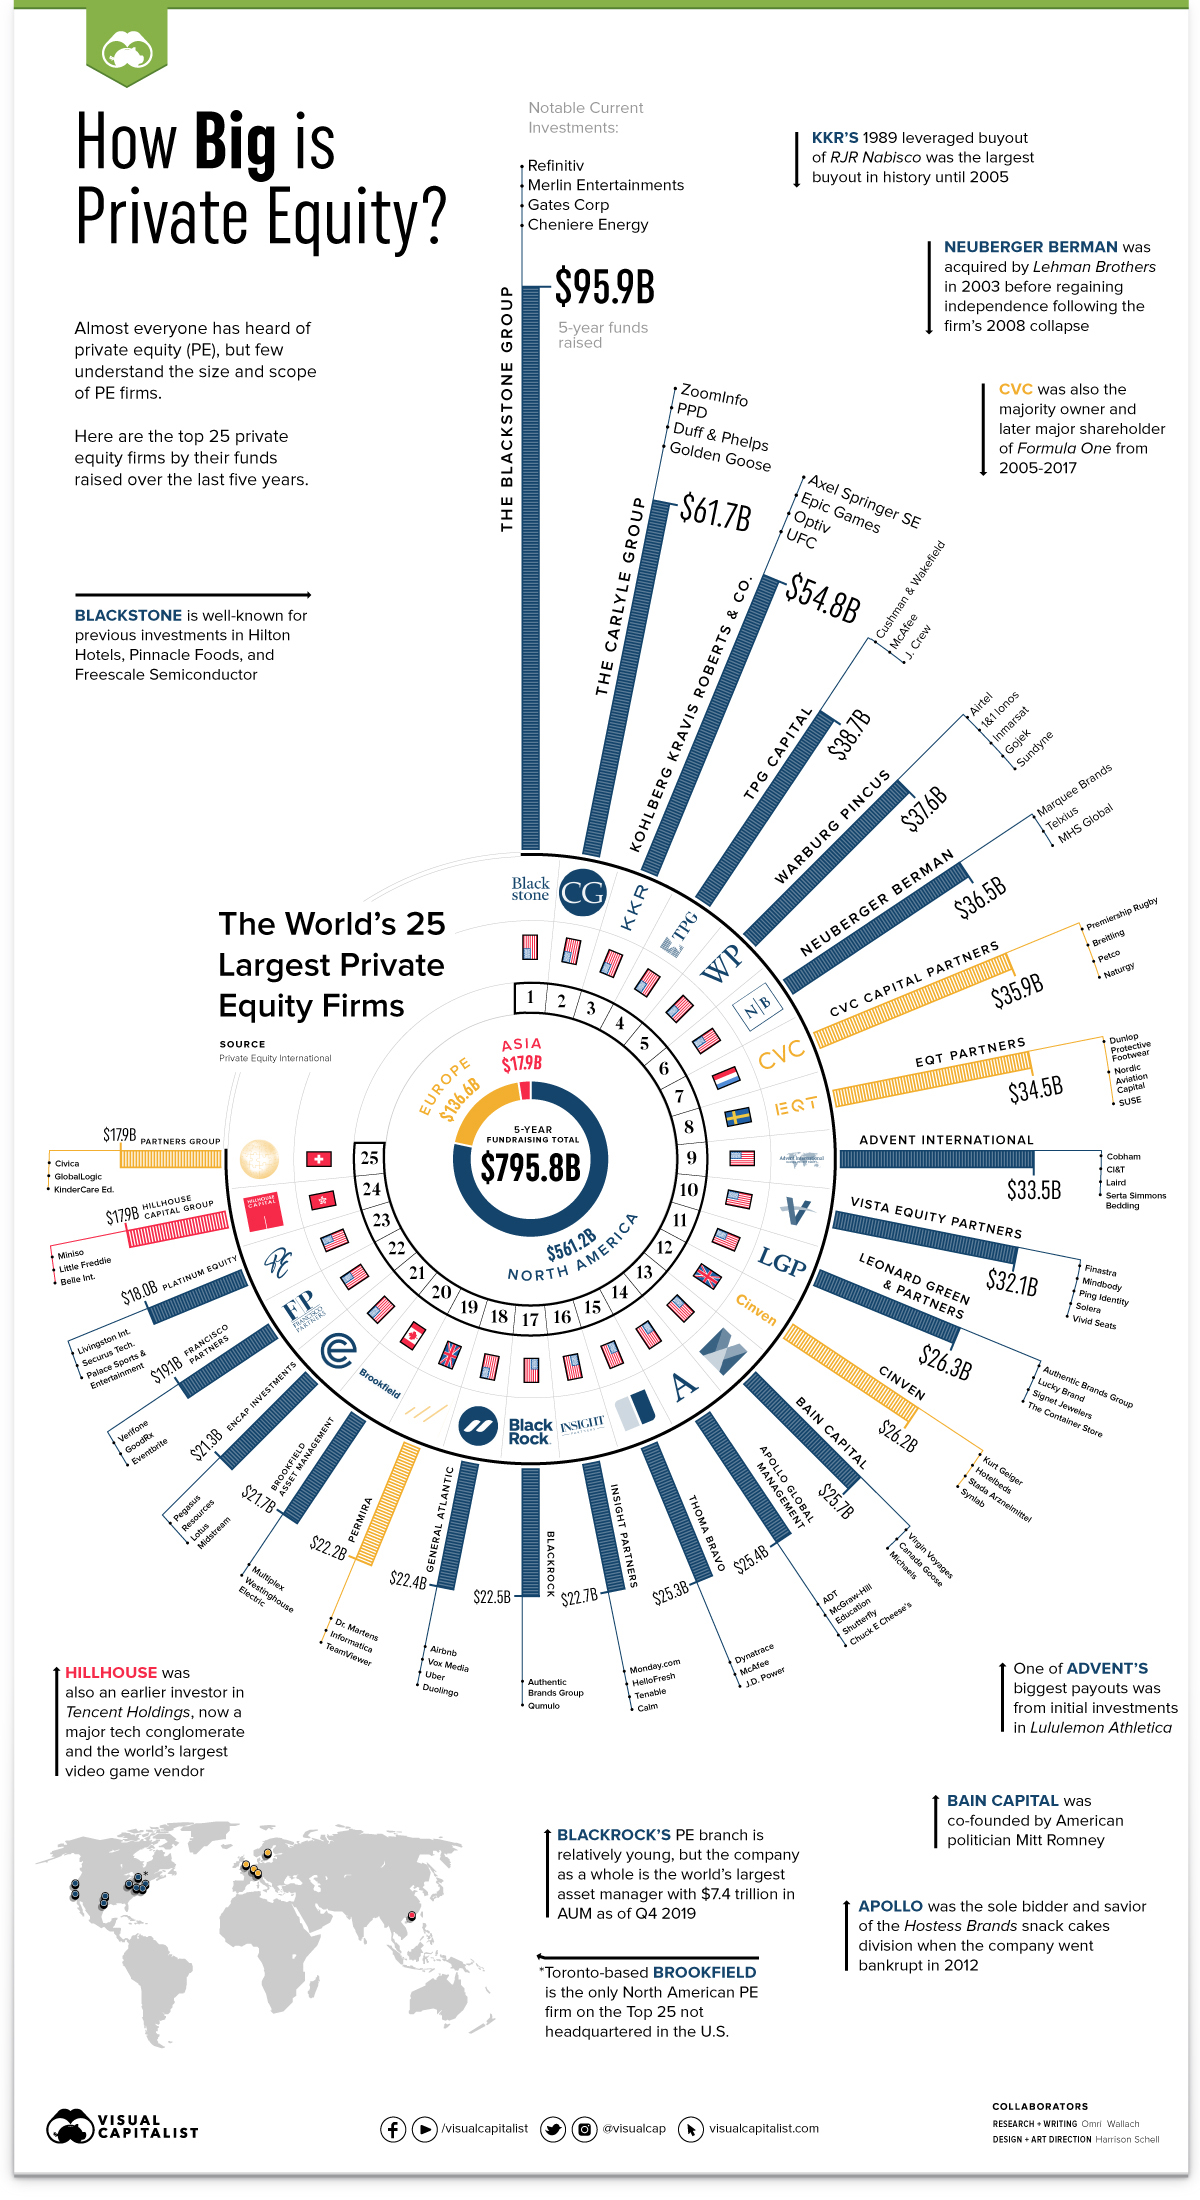
Take a look at this statistical infographic where the designer has presented a very complex set of data and information in an easy-to-grasp manner.
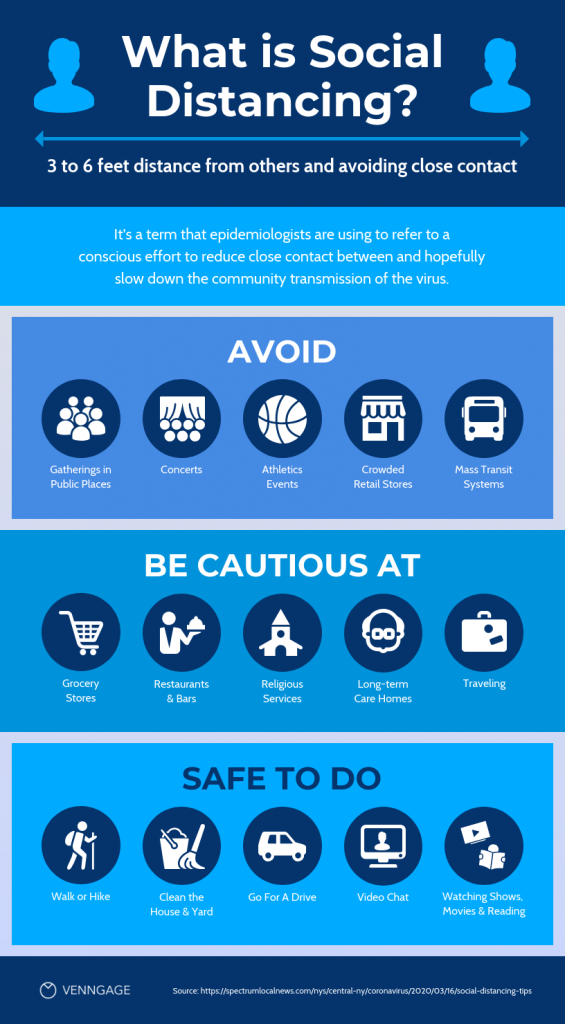
2. Informational Infographics
It’s the best choice for conveying a new idea or explaining a concept.
Generally, an informational infographic has different sections explaining different but related concepts. This design will flow well if each section is colored differently.
In addition, we’ve discovered that readers tend to like infographics with sections separated by design elements.
Here is an example of an informational infographic explaining the concept of social distancing using various clearly-defined sections.
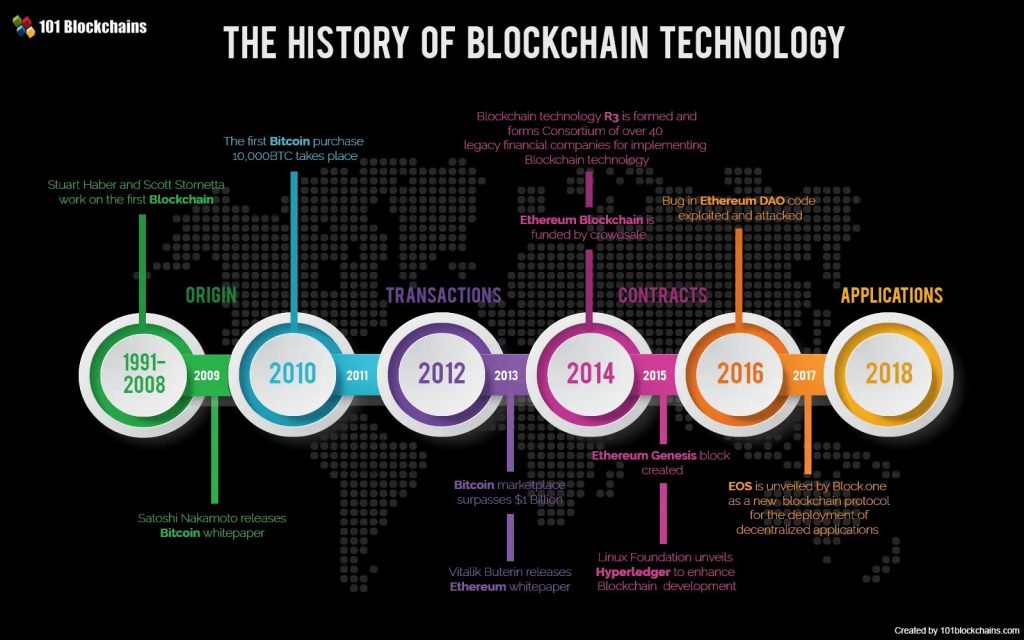
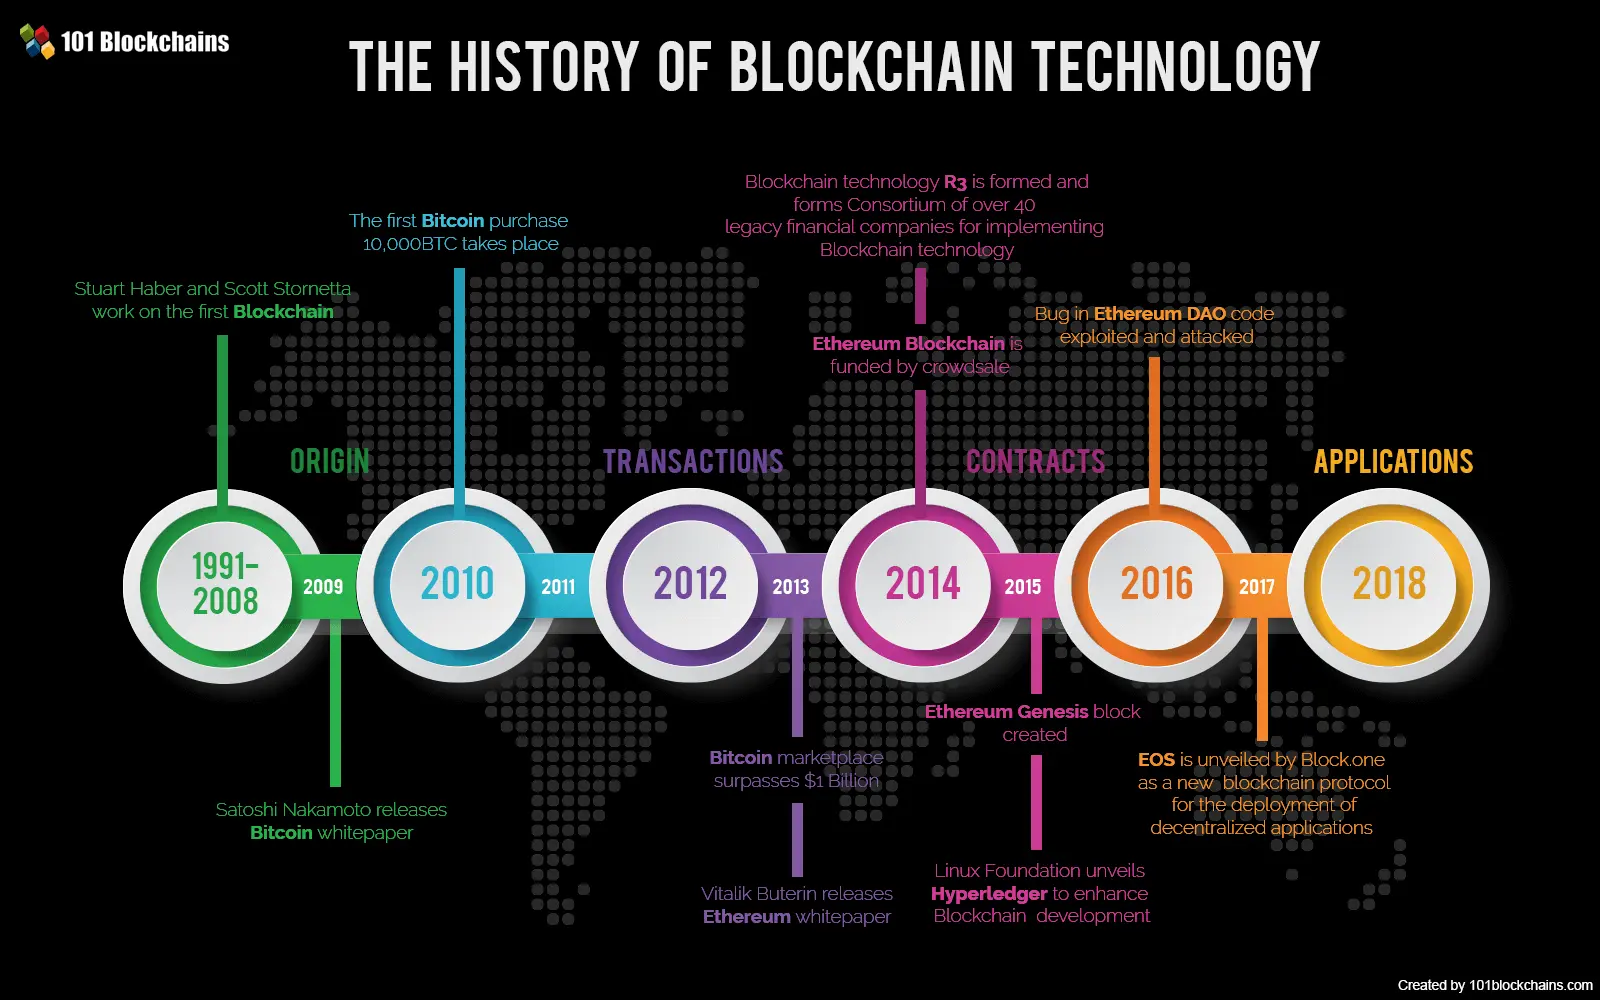
3. Timeline Infographics
Creating a timeline infographic is the best approach for conveying the chronology of something, highlighting significant dates, or summarizing events.
Because time is processed spatially, it is possible to better understand time with a visual aid such as a timeline.
Icons, lines, photos, and descriptions help you explain and plot timeline data well.
Check the below example of a timeline infographic that can be used for link-building.
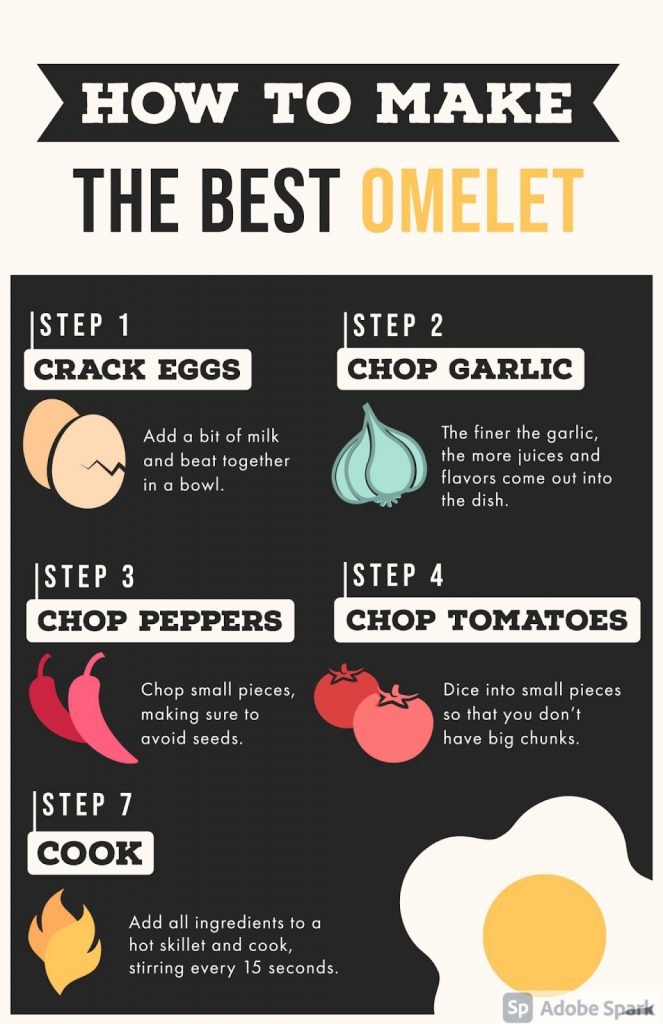
4. Process Infographics
Also known as ‘how-to infographics,” a process infographic is the best visual for listing the steps in a process. You can simplify and clarify each step using a process infographic.
Process infographics are frequently straightforward and flow vertically from top to bottom or horizontally from left to right. Following a process will be much simpler if you number the steps and use arrows to direct from one step to the next.
Here is an illustration of a process infographic.
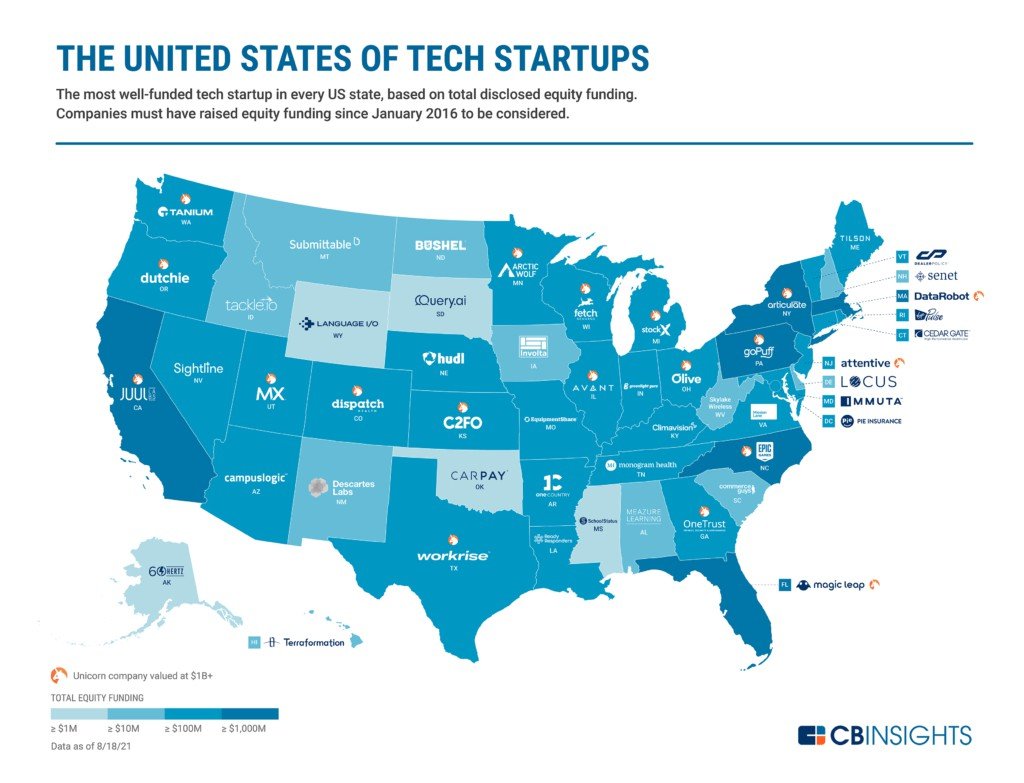
5. Geographic Infographics
Geographic infographics are the best option for visualizing data like audience demographics, locations, etc.
Designers use maps as the visual focus in geographic infographics. Different map charts are suitable for different types of information.
See how elegantly CB Insights has illustrated tech startups by location in the following infographic.
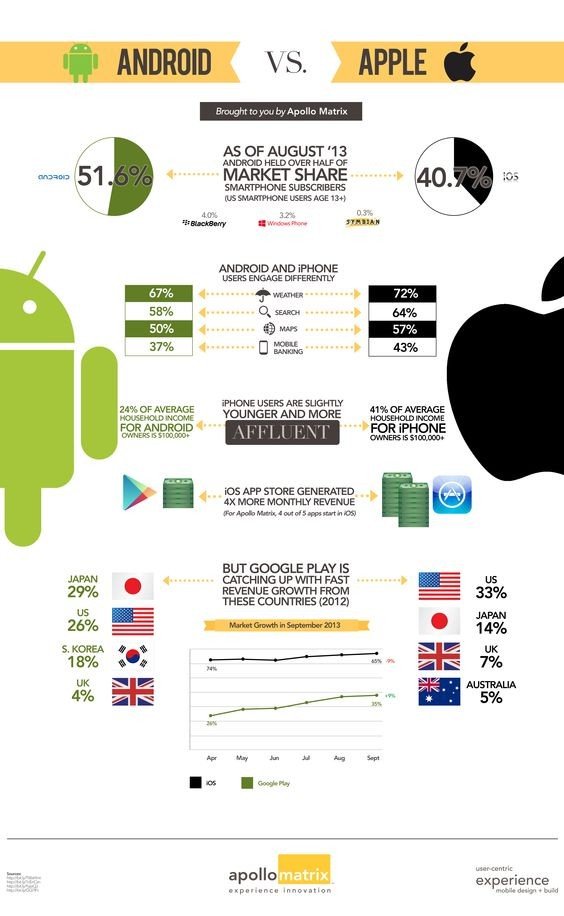
6. Comparison Infographics
A comparison infographic is the ideal infographic to compare two different options in an impartial manner or to make one look superior than the other.
Typically, comparison infographics are divided down the middle, either vertically or horizontally, with one option on each side.
Look at this thoughtfully presented comparison of Android and iOS.
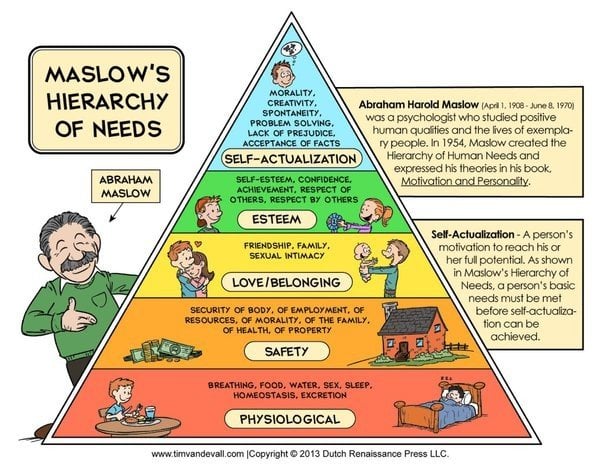
7. Hierarchical Infographics
Typically, this type of infographic consists of a pyramid and is used for educational purposes. From a marketing and link-building perspective, you can use these to educate your customers.
Here is an example:
8. Listicle Infographics
It’s recommended to create a list infographic if you want to share a list of resources, examples, or tips.
Although list infographics are usually straightforward, your goal should be to make them more visually appealing than a conventional list.
You can, for example, use icons to start bulleted lists and different colored fonts to make each element stand out.
For example, check out the following listicle infographic.
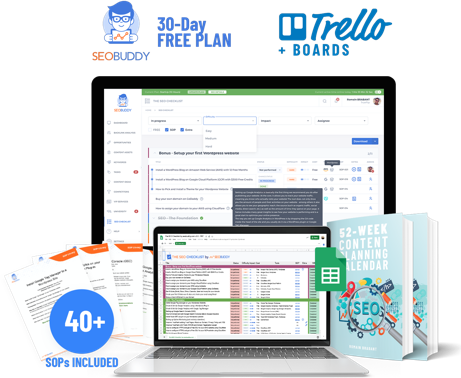
Now it’s time to discover the other 102 steps that will get more organic traffic flowing to your website. Get the SEO Checklist here.
Want to get a sneak peek of what it looks like?
Enter your email and get a free demo version of the SEO Checklist.
How to Do Infographic Link Building in 6 Steps
Following is the step-by-step process for infographic link building.
1. Conduct Topic and Keyword Research
The first step for infographic link building is to pick a high-volume keyword to target.
You don’t want to create an infographic on a subject or keyword that is not actively sought after on Google, Yahoo, and Bing.
Hence, choose from the trending keywords in your niche. Here is how you can conduct keyword research.
Use a keyword research tool, like the ones by Semrush or Ahrefs, and search for a broad industry term relevant to your business.
You’ll find a list of related keywords and keyword ideas to choose from. Pick a few keywords and check their performance metrics like search volume and difficulty score in detail.
Here’s an example of the kind of information you can find on Semrush.
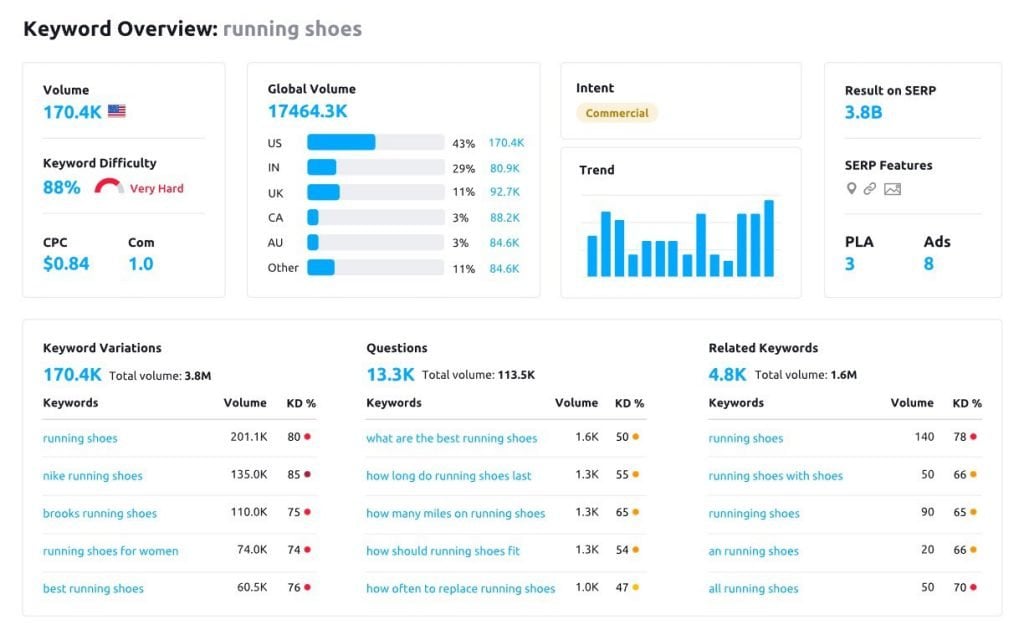
Pick a keyword that is not very difficult to rank for, is specific and relevant to your niche, and has a decent search volume.
Now, do a SERP check for that keyword to find the top-ranking content for that keyword to decide on a topic for your infographic.
2. Do a SERP Check and Find Content for Your Infographic
The next step in the infographic link building process is to do thorough research on what content and visuals to include in your infographic.
Perform a Google search for the keyword to see what infographics are ranking on the SERP.
Here is how you can do it:
Search for “keyword” “infographic” on Google.
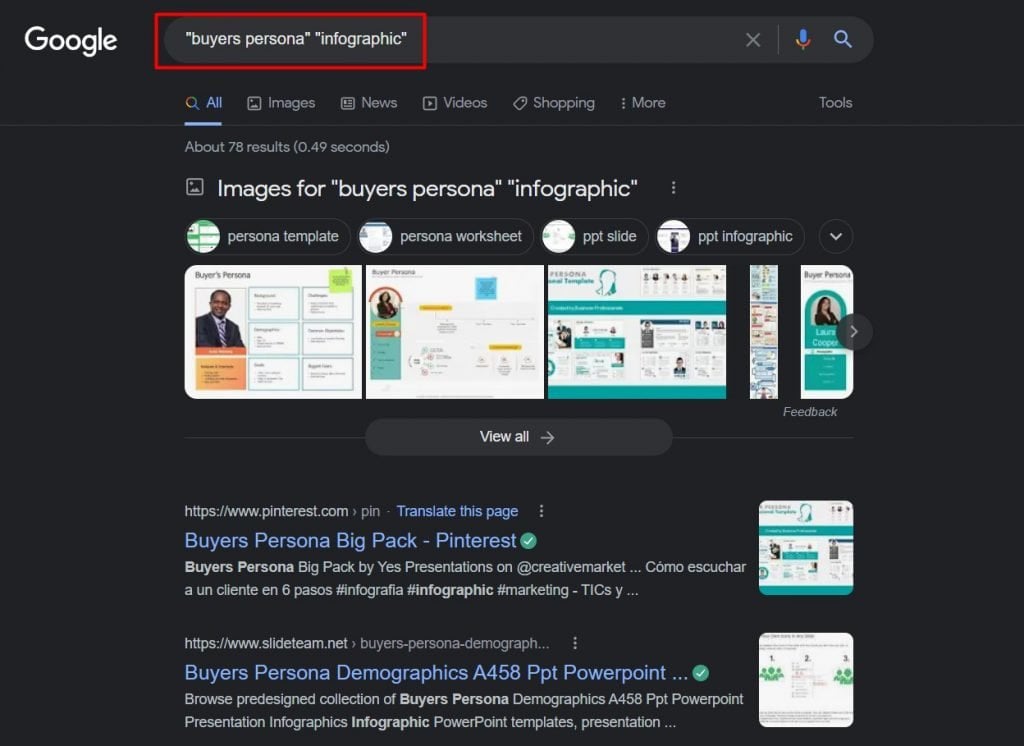
With this simple search operator, you’ll find a lot of infographics that are ranking on the SERP for your chosen keyword.
Go through all the top-ranking ones to identify content gaps (what these infographics are missing) and create a better infographic.
Find relevant statistics, numbers, examples, facts, and other pertinent information on your chosen topic. Once you have all the information you need to create a data-packed infographic, move to the next step in the infographic link building process.
3. Create and Publish Infographic
The next step in the infographic link building process is to create the infographic and publish it on your website.
Your infographic should be visually appealing, well-organized, informative, and useful. You need to use the art of visual storytelling to tell a story through your infographic and engage your audience.
But, how do you frame your content in the most impressive way?
Let’s discuss how you can create a compelling infographic for link building.
Understand Your Goals and Target Audience
Of course, your purpose behind creating infographics is link building. But still, you have to make it worth it for people to read and share the infographic.
Your infographic might be used for educating customers or employees or raising awareness about a topic, or something else. In any case, it is critical to keep your target audience and objective in mind when creating an infographic.
- Consider identifying what you can offer as a takeaway. Ask yourself whether it will be useful to your target audience.
- Try to make your infographic comprehensible by eliminating technical jargon and using words your audience will understand.
- Make sure that the data backs your argument and adds value to it.
Take a look at the following infographic that tells people when to get a flu shot using a simple flow chart. Given that the purpose is to educate the general public, this infographic does a great job of keeping things simple.
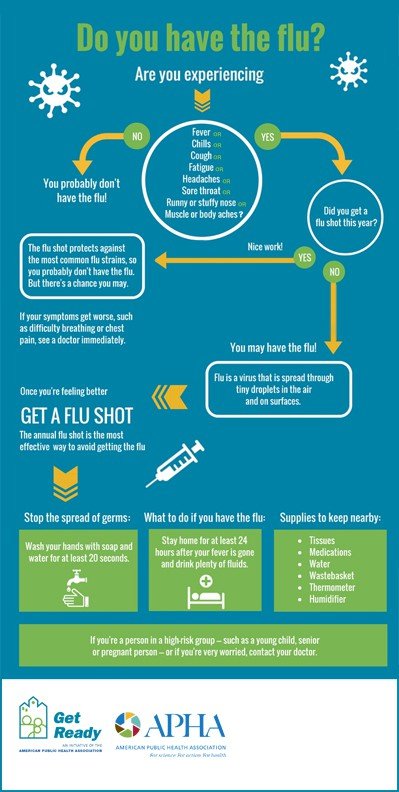
This is also an excellent infographic because it is so actionable.
Anyone reading this can learn when, why, and whether to get a flu shot as well as other ways to avoid and mitigate a flu infection. This is something everyone can comprehend.
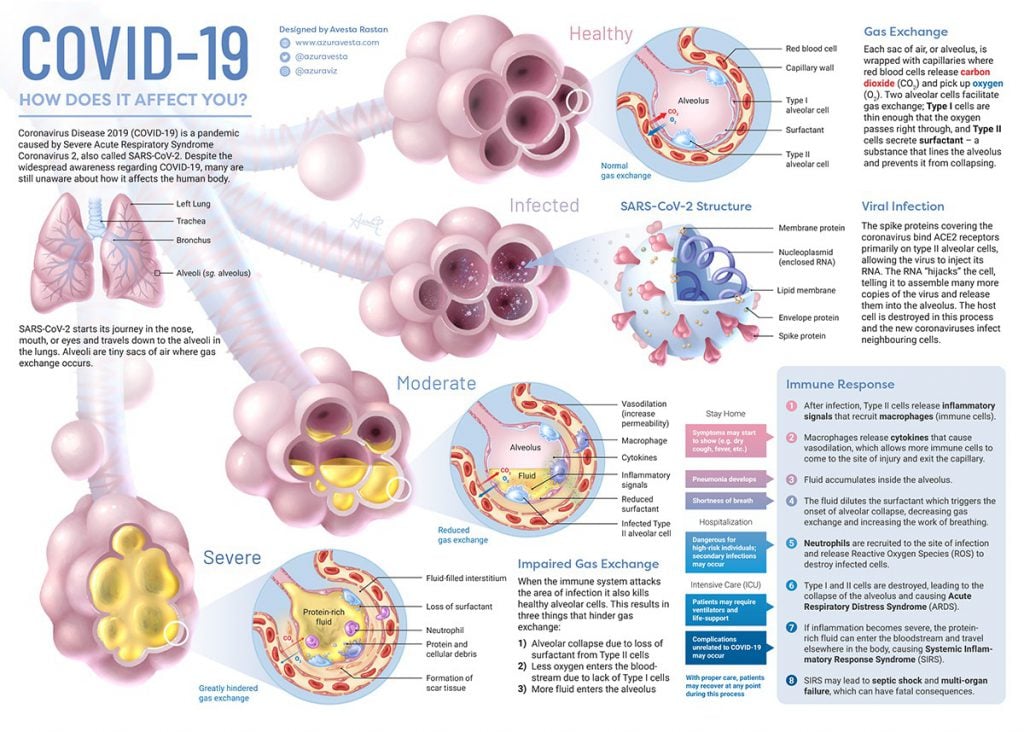
On the other hand, the following infographic includes plenty of technical terms, so it may not be suitable for all audiences. However, if the target audience is medical experts, they would find it informational.
Use Visual Storytelling
Data storytelling is a wonderful method for guiding your audience through numbers and complex information. Knowing what your audience should know is one thing, but helping them get there is another.
Infographics are excellent for telling a story by presenting information in a logical flow.
Instead of throwing several statistics and graphs into your infographic, you must organize the information in an order that forms a story. You can start by determining your starting point and conclusion.
Also, consider your infographic as a visual map of taking your reader from point A to B. And only when you provide the viewers with an exciting and engaging journey they’ll arrive at the destination.
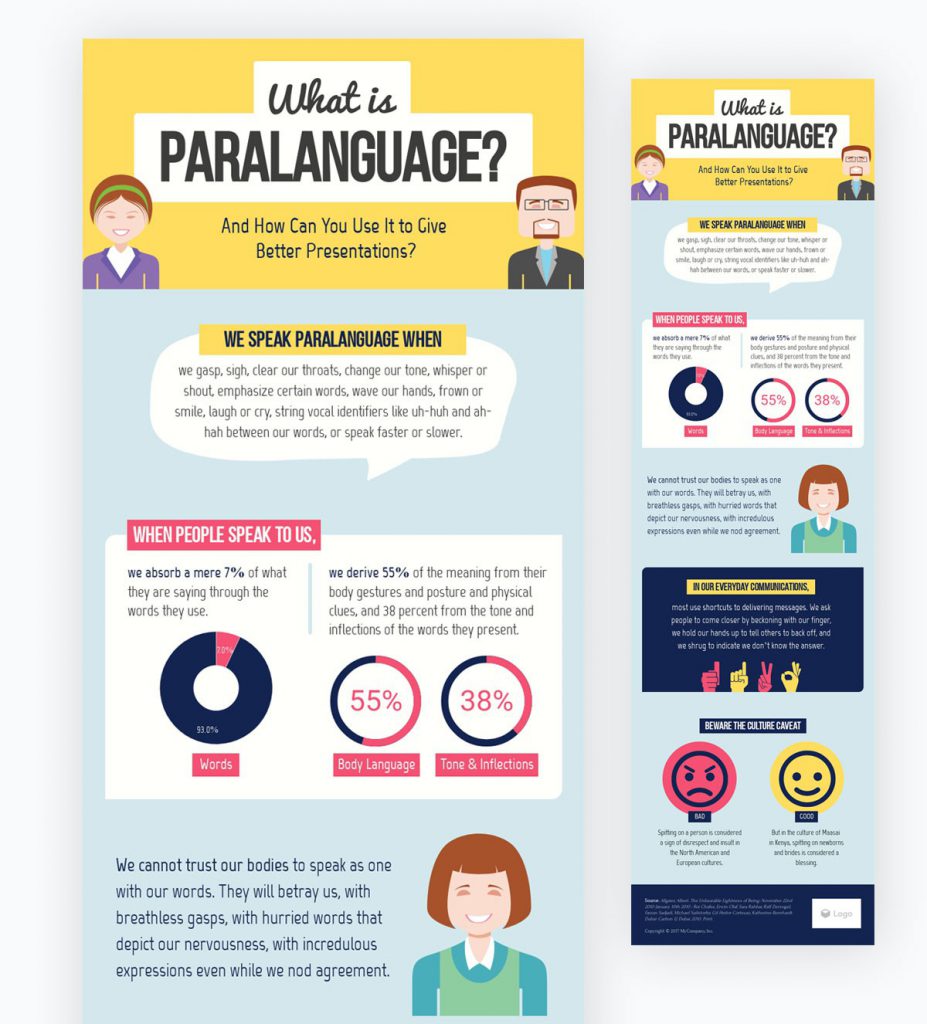
Check the following infographic to see how to use storytelling to convey important information.

The infographic begins by introducing the audience to the subject using a concise summary of why it is important to them and what the infographic covers.
Additionally, the information is made actionable by the tips provided in the infographic.
Pick a Layout that Fits the Information
It was simple to navigate through the last example because the design was intended to assist with the information and purpose of the infographic.
Some information is more complex to organize as visual content than an organized list, a sequential process, or a timeline.
In some cases, you may create a side-by-side comparison, but other times, you may have a pile of statistics you aren’t sure how to integrate.
In such cases, selecting a template will assist you in brainstorming how to organize the information into a coherent whole.
For example, the following infographic includes a variety of information, including quantitative data and categorical descriptions. The information has been grouped into themes that are helpful for the audience to grasp.
The point is that you should pick a theme before you start creating your infographic.
If you don’t have a dedicated designer in-house, you can use online graphic designing tools like Canva to create infographics.
The best part is that these tools will provide you with ready-made templates that you can choose from.
Pro Tip: If you absolutely can’t figure out how to organize your information, simply create well-defined and distinct sections. Thank us later for this trick.
Avoid Common Mistakes and Pitfalls
There are a few mistakes you should avoid when creating an infographic. Here are some of them:
- Including unnecessary descriptions and charts just for the sake of visualization
- Overloading the infographic with visual clutter
- Not designing for your target audience
- Just focusing on the design, not on comprehension
- Getting started without performing keyword research
Avoid these when creating infographics for link building purposes.
Use Visuals that Aid Comprehension, Not Just Aesthetics
One mistake many graphic designers make while creating infographics for link building is that they solely focus on the visual appeal and completely ignore the comprehension aspect.
Many graphic designers don’t have an understanding of graphs and charts. For data visualization, they just pick whatever chart/graph fits well in the design.
That’s why it’s imperative for content writers to work alongside graphic designers to make sure that the infographics are making sense and are easy to understand.
Following are some guidelines for choosing the right visual, but remember that the visuals must be relevant to your content:
- Bar charts are the best for data comparisons.
- If you’re dealing with geographical data, it’s better if you plot it on maps.
- Use horizontal line graphs, flow charts, or timelines for time-related data.
- Venn diagrams and mind maps are excellent for explaining themes.
- If you want to elicit emotions, it’s better to use photos of human faces.
Make Your Infographic Memorable
In a world dealing with content overdose, you need your infographic to stand out. So use your creativity to make your audience remember your infographic.
At the same time, don’t take so much creative freedom that misleads or diverts your audience from the core takeaway of the infographic.
It’s necessary to find a balance between creativity and comprehension.
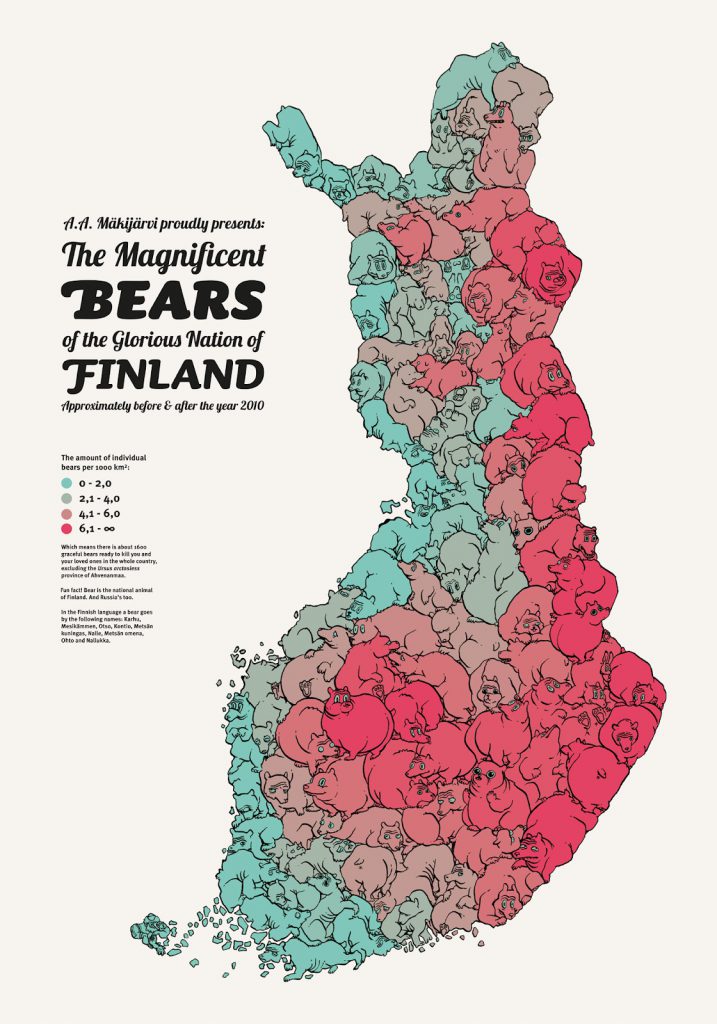
Take a look at the following infographic where the designer could’ve shown data over the map in a straightforward manner; instead, she picked the creative path and came up with this eye-catching design.
Once you’ve created a relevant, easy-to-comprehend, and memorable infographic, move to the next step.
Publish the Infographic to Your Website
The next thing you should do is publish the infographic on your website so that other bloggers and creators (who share your infographic) have a URL to link back to.
The best approach to publishing an infographic for link building is to create a new blog post/page with relevant content and an infographic embed code box.
Here is how you can do it:
Write Supporting Content
Write a short and engaging intro covering some of the points covered in the infographic and encourage people to check out the infographic to learn more.
Your intro needs to persuade the reader to stay with you till the bottom of the page (or at least till the infographic appears).
Also, write 500+ words of additional content below the infographic so that you get the room to make the page SEO-friendly by using relevant keywords. Ensure that the content should be related to the infographic.
Publish Your Infographic
Once you’ve written the supporting content, the next step to infographic link building is to publish the content along with the infographic on your website.
Remember that infographics can have heavy file sizes, which means it might take longer to load.
Here is what you can do to make your infographic easier to load for a better on-page SEO:
- Convert your infographic to WebP format.
- If needed, compress your infographic via tools like TinyPNG or WordPress plugins like Smush.
Lastly, make sure to include a line saying that explicit permission is required to share/use the infographic in exchange for a link in the footer.
To make it easier for people to share your infographic on their website, you can place an embed code at the bottom of the page.
This way, your user can easily copy the code and paste it into their webpage HTML to get access to the infographic, and in return, you’ll get a backlink.
There are several free online embed code generator tools you can use. Here is one to get you started – Embed Code Generator Tool | Zazzle Media.
4. Market the Infographic on Social Media
Before you jump on creating an infographic outreach campaign intended for link building, try to get your infographic viral over social platforms. This will generate organic backlinks to your infographic page.
Focus on the social media platforms that have the best audience for your infographic.
Following are the top platforms where you can post your infographics:
- Pinterest: Being a visual content search engine, Pinterest is the best platform to promote infographics for link building.
- Twitter: Here, you can use relevant hashtags and pay-per-performance ads to get your infographics viral.
- LinkedIn: Best for making your infographic reach professionals from other companies who might be interested in publishing it on their websites.
There are two main ways you can promote your infographic on social media—organically and with the help of influencers.
Market Organically via Your Social Handles
Create a content strategy that includes sharing sneak peeks of your infographic to create hype and drive traffic to your website.
You can share small sections of your infographic, as they’re perfect for social media and give just enough information to make people curious to learn more.
Post a few tweets about your recent infographic and share an excerpt from your infographic on Twitter or LinkedIn. This should increase your referral traffic and help in infographic link building.
But what if you don’t have a huge following and engagement on your social handles?
Then, consider the following.
Collaborate with Influencers in Your Niche
When you don’t have a strong social presence, working with influencers in your niche can be a winning strategy for infographic link building.
But how do you find and reach out to these people in your niche?
It’s simple. Just head to your preferred social platform and search for hashtags related to your niche.
For example, if you have to find influencers in the digital marketing niche, you can simply search for “#digitalmarketing” and glance through the results.
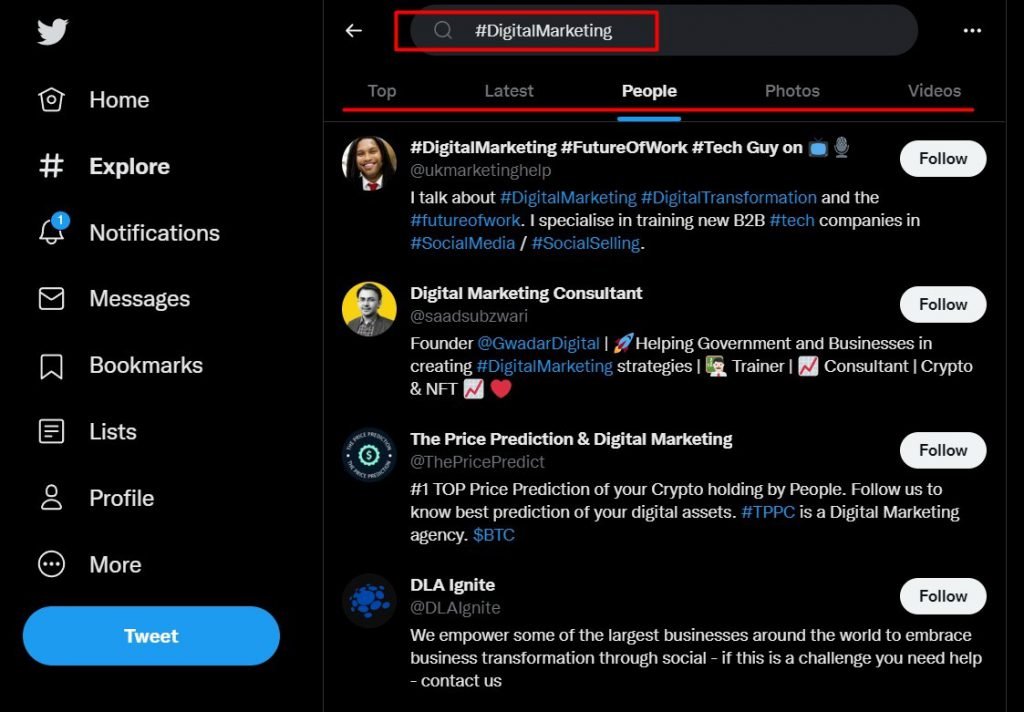
Check out the top posts and you’ll find influencers in your niche.
Alternatively, you can use one of the numerous influencer search tools available in the market to conduct a more targeted search.
Once you identify 5-10 influencers who regularly post on the social platforms, you can reach out to them by sending a direct message or email.
You can say something like,” I’ve recently created an infographic on [insert topic here], and I believe your readers would enjoy it. Please check it out and share if you find it useful?”
The point is to share the infographic with them and request a share. You can also offer monetary compensation for a more formal collaboration.
5. Perform Outreach and Distribution
Infographic outreach is an infographic link-building strategy with which you can gain credible links, mentions, and exposure.
Following are the top ways for infographic link building via outreach and distribution.
a. Find Relevant Websites to Share Your Infographic
The main approach to infographic link building is reaching out to bloggers and webmasters of relevant sites in your niche and asking them to publish your infographic.
Bloggers tend to have a high domain authority and website traffic, which means if you can get your infographic featured there, you earn high-quality backlinks.
But how do you find these websites and bloggers for infographic link building?
There are several techniques to find domains (including blogs) in your niche that accept infographic posting requests. Let’s go through them one by one.
Google Search Operators
The most straightforward way to find domains for infographic link-building is to use Google Search Operators.
Google Search Operators are words and symbols that assist Google in improving SERP results. You can tell Google what it must include or exclude in the SERP using search operators.
For example, you can quote a search query (such as “infographic link building”) to make sure that Google only returns those URLs that contain an identical match for the text you searched for.
Here is how you can use google search operators to find domains for infographic link building:
Search for “[your keyword]” blog, and you’ll find blogs that are relevant to your infographic topic.
For example, if your infographic is about consumer behavior, you can search for the following queries:
- “Consumer behavior” blog
- “Customer behavior” blog
- “Customer buying behavior” blog
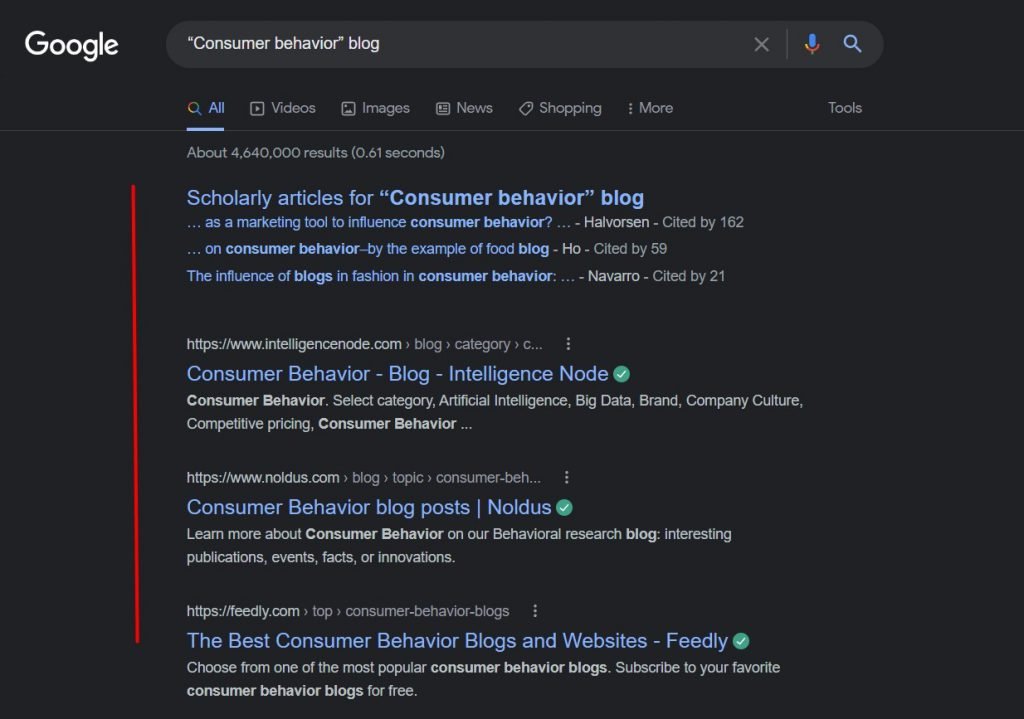
You can see with this simple search, you can get articles relevant to your topic, which will lead you to the right websites.
Analyzing Competitors’ Backlinks
Another way to find websites for infographic link building is by analyzing competitors’ backlinks and finding the sites that they’re getting backlinks from.
Here is how you can do it:
Use an SEO tool like Semrush or Ahrefs to extract the competitors’ backlinks data.
For example, you can get the list of domains where your competitor has built backlinks by putting their specific page (which ranks for your targeted keyword) in the Semrush tool.
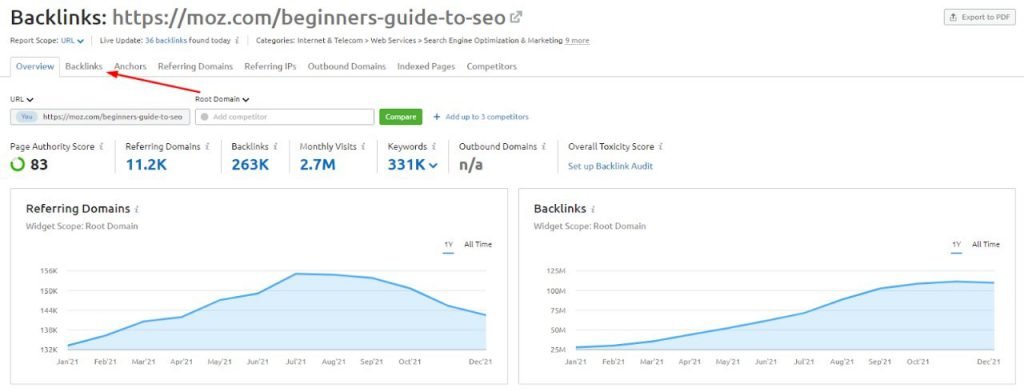
This should unveil many web pages from where your competitor is getting backlinks.
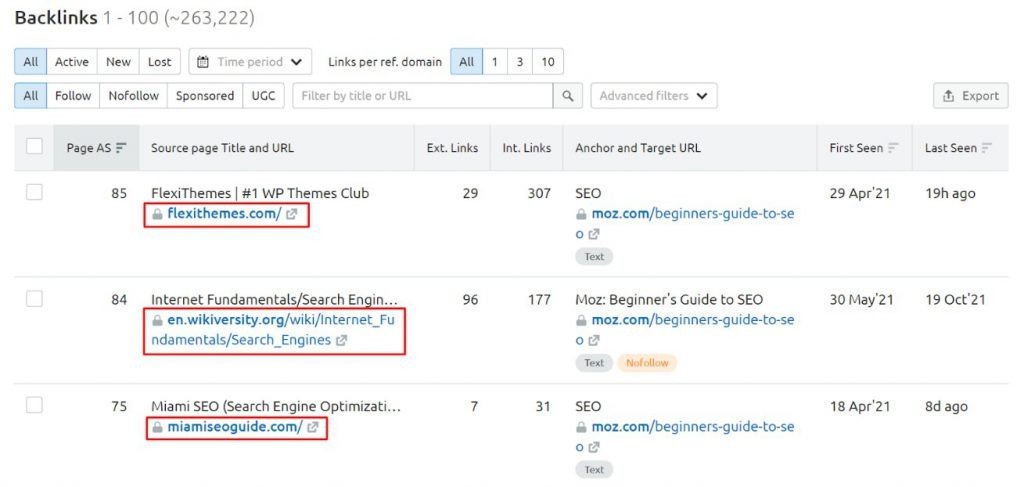
You can simply visit these web pages and find infographic link building opportunities on relevant blogs on these particular domains.
If you have trouble finding relevant blog posts on a specific domain, try this search operator: site:domain.com “your keyword”.
This should get you all the relevant web pages and blogs in that particular domain, where you can look for infographic link-building opportunities.
b. Pitch Your Infographic
When you’ve found the right websites for link building, look for the right spots within the sites where your infographic can add value to the reader.
For example, this blog on customer acquisition cost has a content gap in terms of explaining customer journey. Also, the blog doesn’t have visual content in it.
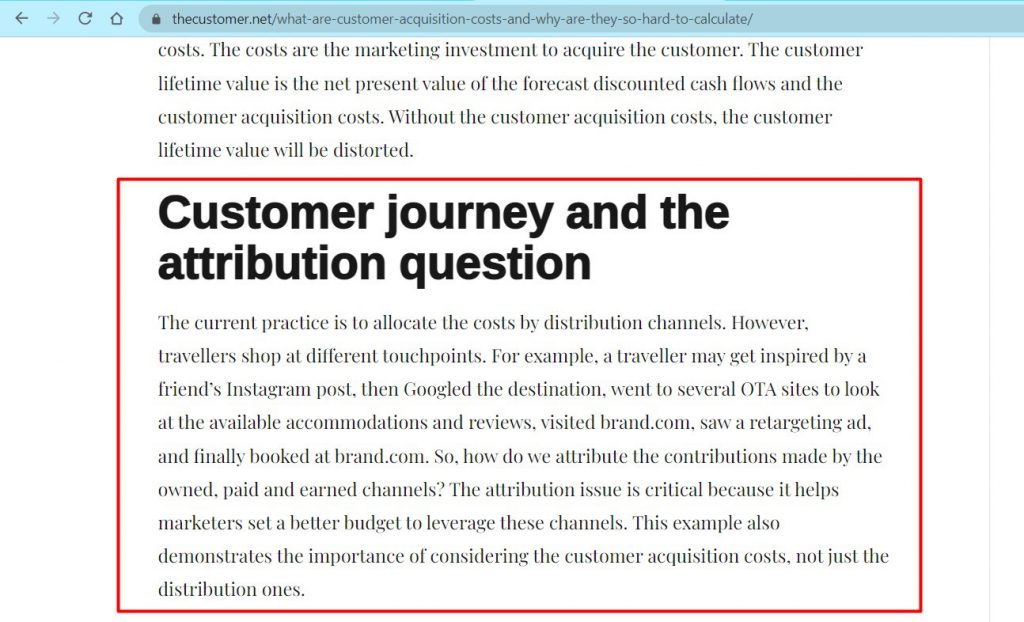
Here, the addition of an infographic can aid the blog’s readability and content quality. You can simply reach out to the site editor or admin and suggest your infographic for this blog like this:
Hi (NAME),
I was researching some awesome blogs on (BLOG TOPIC) today when I came across your piece: (ARTICLE TITLE).
Very insightful stuff!
Actually, I recently designed an infographic on (YOUR TOPIC), which can be a great addition to your article.
I’ve attached the infographic to this email. Do check it out and let me know if you’d like to embed it into your blog.
Thanks,
Your Name
If the site owner or editor responds positively to your email, you can share your embed code with them and ask for a link to your original infographic.
And just like that, you get an authoritative and contextual backlink.
c. Submit your Infographic to Infographic Submission Sites
Another infographic link-building technique is to submit your infographic to sites that allow direct infographic submissions.
There are several paid as well as free infographic directories and submission sites where you can post your infographic for link-building purposes.
To find infographic submission sites, simply search for “infographic submission” and you’ll find a list of domains where you can publish your infographic.
To get you started quickly, here is a list of websites you can use for infographic link building:
- Graphs.net
- Infographicsarchive.com
- Voolinfographics.com
- Infographicsshowcase.com
- Infographicbee.com
- Infographicjournal.com
- Visual.ly
- Infographicreviews.com
- Submitinfographics.com
- Behance.net
- Revuwire.com/submit-infographics
- Infographicpost.com
- Infographicplaza.com
- Dailyinfographic.com
- Infographicsdirectory.blogspot.com
- Visulattic.com
- Shithot.co.uk
- Infographicdatabase.com
- Galleryr.org
- Mediacaffeine.com/infographics
- Theinfographics.blogspot.com
- Allinfographics.org
- Bestinfographic.co.uk
- Visualkiwi.com/category/visual-community
- Infographicportal.com
Hope they’re useful to you. But, if you want to get access to a wide variety of backlinking domains, you can get our Link Chest. It will give you a ready-to-use list of 2000+ backlink opportunities from high-authority websites.
Generally, the infographic submission sites are looking for fresh, creative, and fun new infographics related to all industries.
Although, some may ask you the following along with the infographic:
- Infographic title
- Unique and non-plagiarized content of 100-500 words
- Infographic embed code
- Original source of the infographic
- Category
- Author bio
Make sure you have them ready while submitting your infographic for link building purposes.
The Link Chest is a collection of high-quality, easy-to-win backlink opportunities. It’s the smart way to kickstart your SEO mission and improve the rank of your website in Google.

“This is such a simple idea but very well executed. I’ve been powering through this giant list of backlinks for a few hours and already have loads pointing to my site. Link Chest is an essential tool for early stage link building.”
6. Track Your Progress
Infographic link building is a time and resource-consuming process.
Hence, it is important to keep track of the links, shares, and retweets you receive in order to ensure you are heading in the right direction.
The reason is that you may lose links over time due to a variety of reasons:
- The linking website has deleted your infographic submission
- The linking website has removed your link
- They may have used a wrong version of your URL while linking
Whatever the reason, losing backlinks means that all the work you’ve done for infographic link building has been a waste.
You can use the backlink checking tools to keep an eye on your backlinks.
Also, bloggers sometimes use infographics without linking to the source on their websites. This is a missed infographic link-building opportunity for you.
How can you remedy the situation?
You can use Google Image Search to find such websites and request a link from them. Don’t forget to thank them for featuring your infographic and offer them the embed code or a link to the original source.
FAQs
1. Can you put links in infographics?
Yes, you should make your infographics clickable and link to the original source whenever possible.
You can make your infographic clickable by using the following code in the HTML:
<a href=”your landing page url”>
<img src=”your image url” />
</a>
2. How do you perform infographic link building and boost your SEO?
Here is how you can do infographic link building:
- Create a compelling infographic on a trending topic niche
- Publish your infographic to your website
- Market your infographic on social platforms
- Reach out to influencers in your niche and ask them to share your infographic
- Find bloggers and similar websites to share your infographic
- Suggest infographic addition to these blogs and websites
- Submit your infographic to infographic submission sites
- Track your progress via SEO tools
3. What are the types of infographics I can use for link building?
Following are the most common types of infographics marketers use for link building:
- Statistical infographics
- Informational infographics
- Timeline infographics
- Process infographics
- Geographical infographics
- Comparison infographics
- Hierarchical infographics
- Listicle infographics
4. How do I create a compelling infographic for link building?
Here is how you can create eye-catching infographics for your next link-building campaign:
- Conduct keyword and content research
- Avoid unnecessary and wrong info
- Identity purpose and make it useful
- Use storytelling
- Pick a suitable layout for your info
- Include relevant statistics and research
- Use visuals
- Use your creativity
5. Does link building still work?
Investing in a link-building campaign can still be one of the most effective SEO tactics for improving a site’s visibility.
As Google continues to assess a site’s credibility based on high-quality backlinks, you should be aware that link building remains an important SEO strategy.
Following are the best strategies for link building:
- Guest posting
- Participating in conversations and community forms
- Infographic link building
- Broken link building
- Unlinked mentions
- Building links via business directories and local listings
- Helping a reporter out (HARO)
- Expert roundups and participations
Conclusion
When doing infographic link building, you need to ensure that you create backlinks from domains that have high domain authority and low spam score.
You should also follow some of the common link building best practices recommended by experts. Use our link building checklist to get a comprehensive guide to link building.
And if you need help with other aspects of SEO, download our comprehensive SEO checklist and boost your SEO performance. All the best!
CEO & Founder at SEO Buddy


Thank you so much for sharing this guideline, really appreciate it. Been planning to try using infographic link building recently and this article is such a blessing. Glad that I stumbled upon this article, I will be using this as a guideline when starting my infographic link building journey. Once again, thank you so so much for sharing the good stuff.
O god! I wish i had found this site before. A lot of appreciation from my side.